Architecture
AlphaSearch has four main layers:
- Data & Forecasting
- Optimization & Control
- Reasoning & Explanation
- Streamlit UI
1. Core Libraries
agentic_energy: Battery schemas, forecast models, optimization models, data loaders, MCP servers.agentics: Generic agent orchestration, CrewAI integration, tool abstractions
2. Agents & MCP Tools
- Forecasting MCP tools: price forecast generation
- Optimization tools: MILP solver, heuristic controllers, RL policy server
- Reasoning tools: explanation text + annotated plots
- LLM tools: Gemini / Ollama for chat and reasoning Each tool is exposed through MCP and can be called by the agentic framework or directly in notebooks. Check details in Agents and Tools page.
3. High-Level Flow
-
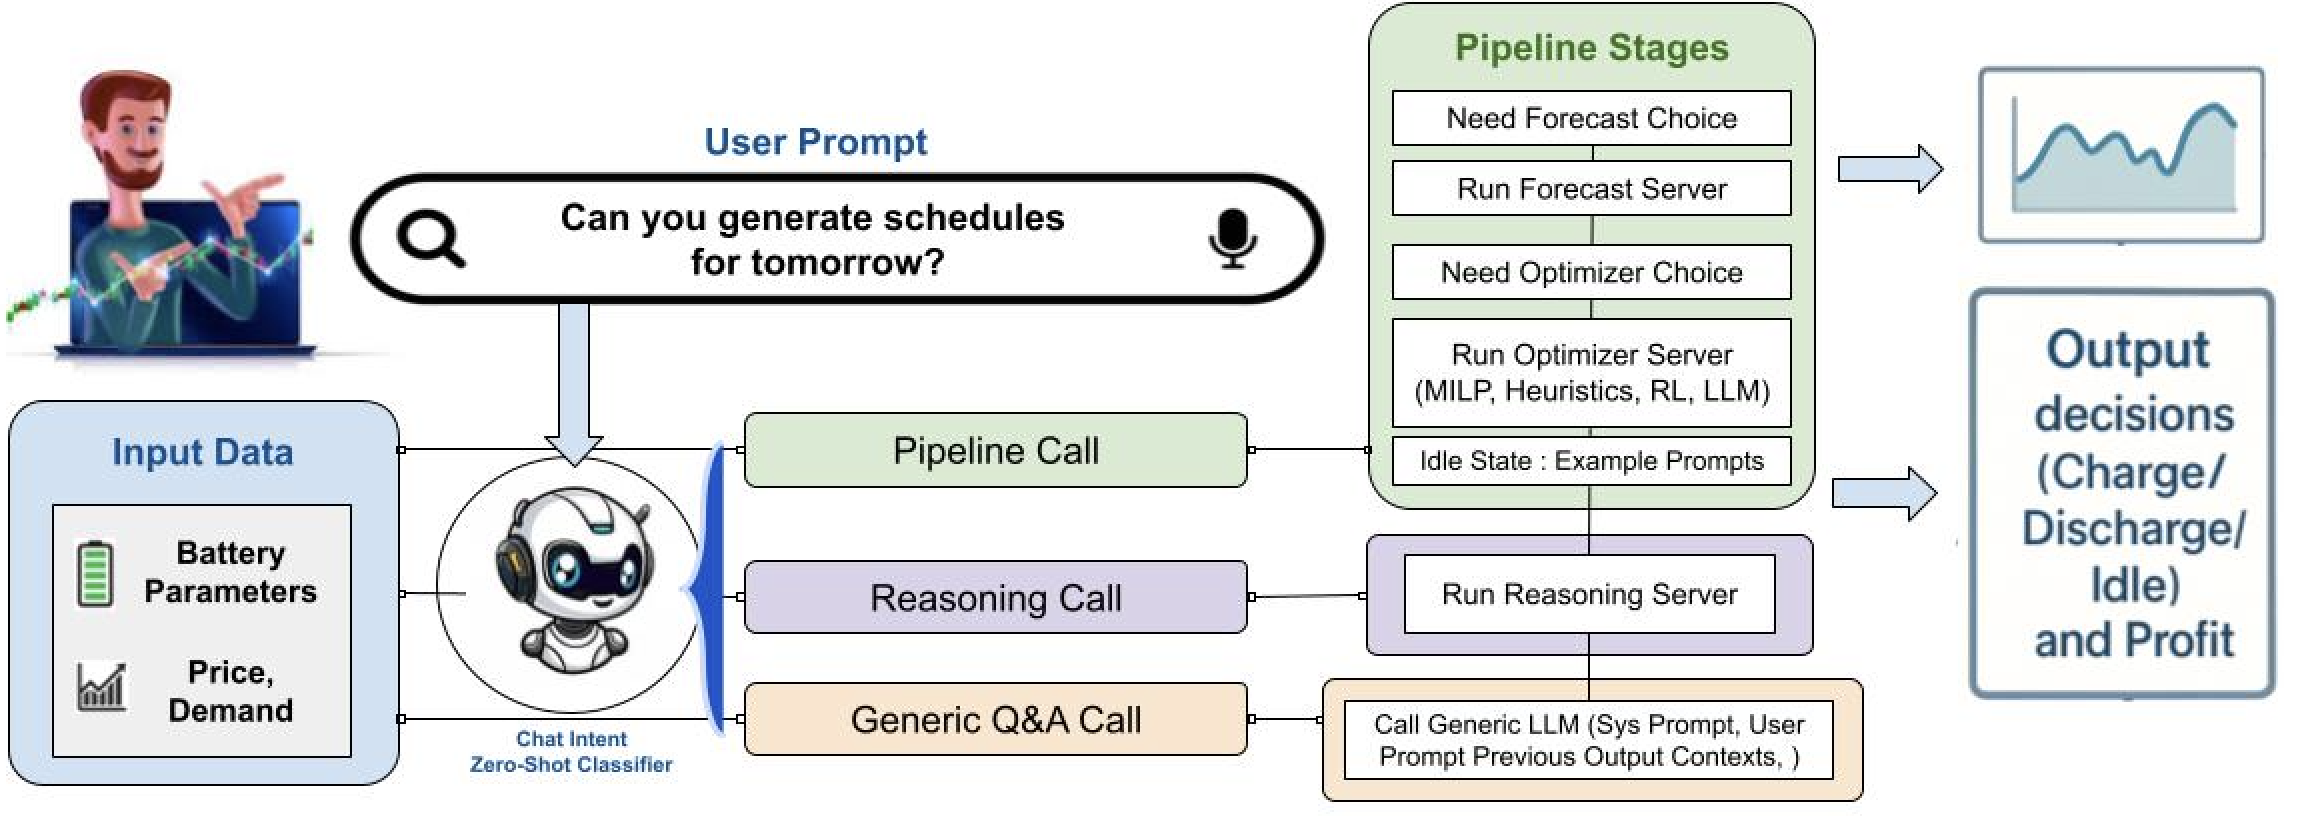
User types a prompt in the Streamlit chat box.
-
A zero-shot intent classifier maps it to:
Pipeline call,Reasoning call,Generic Q&A -
For a
pipeline call:- The forecast agent chooses a model and generates price trajectories
- The optimizer agent picks an algorithm and computes a schedule
- The visualization MCP produces plots and animations
-
For a
reasoning call: A reasoning agent inspects the last run and explains why decisions were made -
For
generic Q&A: The LLM answers using chat history + recent pipeline results as context.
4. Streamlit UI Guide
The main UI has three panels.
1. Left: Battery Parameters
Configure:
- Capacity (MWh)
- Initial / minimum / maximum state of charge
- Maximum charge/discharge power
- Charge and discharge efficiencies
- Target SoC at the end of day
These parameters define hard constraints used by the optimizers.
2. Center: Chat with the Arbitrage Agent
You can type natural-language prompts like:
- “Can you help me generate schedules for tomorrow?”
- “Run the optimizer with MILP.”
- “Why did the battery discharge so aggressively in the afternoon?”
- “Is this schedule trustworthy?”
The app shows intermediate steps (forecast completion, optimizer choice, etc.) as messages in the chat.
3. Right: Data, Forecast, & Optimization Results
Example visual outputs:
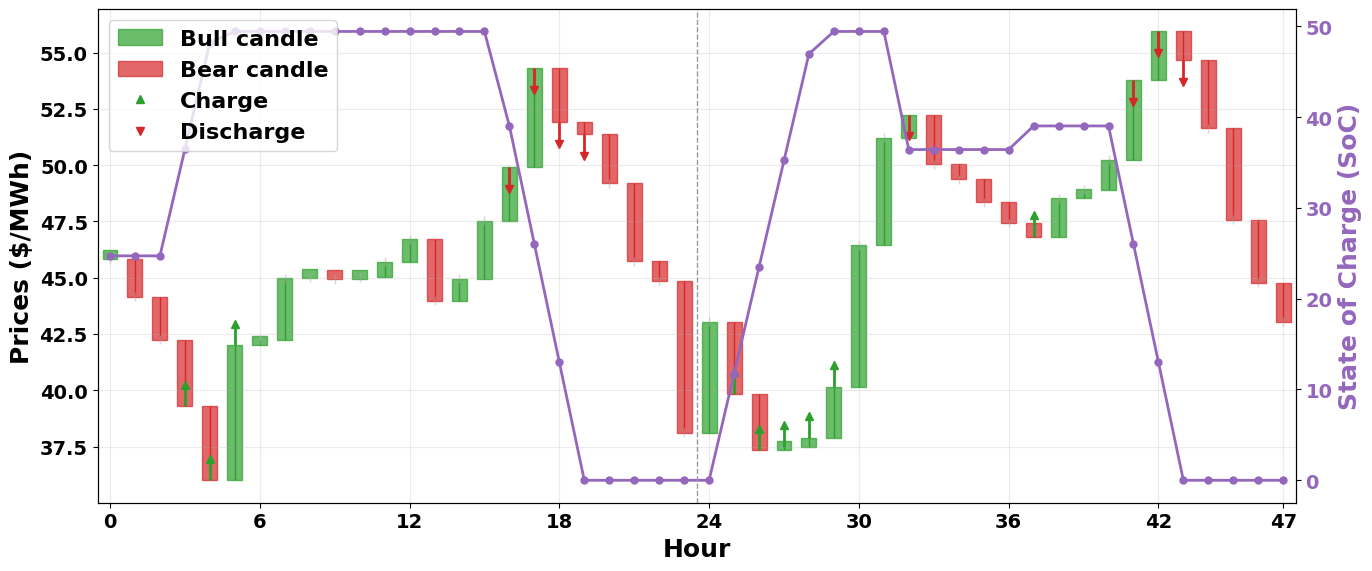
- Price forecast with green/red shading to indicate low/high price zones
- Bar plots or animations for charge/discharge power
- SoC trajectories respecting bounds
- Text summaries of total charge, discharge, efficiency, and net objective cost
Negative objective cost means net earnings from arbitrage under the given forecast and constraints.
Some plots that you may encounter: